
#include <stdio.h>#include <math.h>#include <string.h>#include "math_graphics.h"#include "PloEch.h"#include "GetProperty.h"#include "SetProperty.h"#include "DrawObjects.h"#include "BuildObjects.h"#include "Axes.h"#include "Xcall1.h"#include "Gray.h"#include "sciprint.h"#include "CurrentObjectsManagement.h"#include "MALLOC.h"Include dependency graph for Gray.c:
Go to the source code of this file.
Functions | |
| void fill_grid_rectangles | __PARAMS ((integer *x, integer *y, double *z, integer n1, integer n2)) |
| void | GraySquare1_NGreverse (integer *x, integer *y, double *z, integer n1, integer n2, sciPointObj *psubwin) |
| void | GraySquareDirect (integer *x, integer *y, double *z, integer n1, integer n2) |
| void | GraySquareScaled (integer *x, integer *y, double *z, integer n1, integer n2) |
| void | initsubwin () |
| void | compute_data_bounds2 (int cflag, char dataflag, char *logflags, double *x, double *y, int n1, int n2, double *drect) |
| BOOL | update_specification_bounds (sciPointObj *psubwin, double *rect, int flag) |
| int | re_index_brect (double *brect, double *drect) |
| BOOL | strflag2axes_properties (sciPointObj *psubwin, char *strflag) |
| int | CreatePrettyGradsFromNax (sciPointObj *psubwin, int *Nax) |
| int C2F() | xgray (double *x, double *y, double *z, integer *n1, integer *n2, char *strflag, double *brect, integer *aaint, BOOL flagNax, long int l1) |
| static void | GraySquare_base (integer *x, integer *y, double *z, integer n1, integer n2) |
| void | GraySquare (integer *x, integer *y, double *z, integer n1, integer n2) |
| int C2F() | xgray1 (double *z, integer *n1, integer *n2, char *strflag, double *brect, integer *aaint, BOOL flagNax, long int l1) |
| int C2F() | xgray2 (double *z, integer *n1, integer *n2, double *xrect) |
| static void | GraySquare1_base (integer *x, integer *y, double *z, integer n1, integer n2) |
| void | GraySquare1 (integer *x, integer *y, double *z, integer n1, integer n2) |
| void compute_data_bounds2 | ( | int | cflag, | |
| char | dataflag, | |||
| char * | logflags, | |||
| double * | x, | |||
| double * | y, | |||
| int | n1, | |||
| int | n2, | |||
| double * | drect | |||
| ) |
| int CreatePrettyGradsFromNax | ( | sciPointObj * | psubwin, | |
| int * | Nax | |||
| ) |
Definition at line 205 of file Gray.c.
References fill_grid_rectangles(), GetDriverId(), and GraySquare_base().
00206 {
00207   if ( GetDriverId() == 0 )
00209     fill_grid_rectangles(x, y, z, n1, n2);
00210   else
00211       GraySquare_base(x, y, z, n1, n2);
00212 }
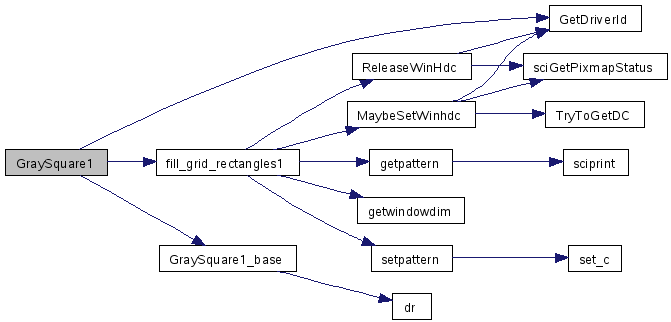
Here is the call graph for this function:

Definition at line 398 of file Gray.c.
References fill_grid_rectangles1(), GetDriverId(), and GraySquare1_base().
Referenced by drawGrayplotEntity().
00399 {
00400
00401   if ( GetDriverId() == 0 )
00403     fill_grid_rectangles1(x, y, z, n1, n2);
00404   else
00405     GraySquare1_base(x, y, z, n1, n2);
00406 }
Here is the call graph for this function:
Here is the caller graph for this function:

| static void GraySquare1_base | ( | integer * | x, | |
| integer * | y, | |||
| double * | z, | |||
| integer | n1, | |||
| integer | n2 | |||
| ) | [static] |
Definition at line 377 of file Gray.c.
References Abs, C2F, dr(), h, i, int16max, j, L, PD0, PI0, uns16max, and w.
Referenced by GraySquare1().
00378 {
00379   integer i,j,verbose=0,narg,fill[1],cpat,xz[2];
00380   C2F(dr)("xget","pattern",&verbose,&cpat,&narg,PI0,PI0,PI0,PD0,PD0,PD0,PD0,0L,0L);
00381   C2F(dr)("xget","wdim",&verbose,xz,&narg, PI0, PI0,PI0,PD0,PD0,PD0,PD0,0L,0L);
00382   for (i = 0 ; i < (n1)-1 ; i++)
00383     for (j = 0 ; j < (n2)-1 ; j++)
00384       {
00385         integer w,h;
00386         fill[0]= (integer) (z[i+(n1-1)*j]);
00387         C2F(dr)("xset","pattern",&(fill[0]),PI0,PI0,PI0,PI0,PI0,PD0,PD0,PD0,PD0,0L,0L);
00388         w=Abs(x[j+1]-x[j]);
00389         h=Abs(y[i+1]-y[i]);
00390         /* We don't trace rectangle which are totally out **/
00391         if ( w != 0 && h != 0 && x[j] < xz[0] && y[i] < xz[1] && x[j]+w > 0 && y[i]+h > 0 )
00392           if ( Abs(x[j]) < int16max && Abs(y[i+1]) < int16max && w < uns16max && h < uns16max)
00393             C2F(dr)("xfrect","v",&x[j],&y[i],&w,&h,PI0,PI0,PD0,PD0,PD0,PD0,0L,0L);
00394       }
00395   C2F(dr)("xset","pattern",&cpat,PI0,PI0,PI0,PI0,PI0,PD0,PD0,PD0,PD0,0L,0L);
00396 }
Here is the call graph for this function:

Here is the caller graph for this function:

| void GraySquare1_NGreverse | ( | integer * | x, | |
| integer * | y, | |||
| double * | z, | |||
| integer | n1, | |||
| integer | n2, | |||
| sciPointObj * | psubwin | |||
| ) |
Definition at line 413 of file Gray.c.
References Abs, sciSubWindow::axes, C2F, dr(), FREE, h, i, int16max, j, L, MALLOC, NULL, PD0, PI0, pSUBWIN_FEATURE, AXES::reverse, TRUE, uns16max, and w.
Referenced by drawGrayplotEntity().
00414 {
00415   int i,j;
00416   integer verbose=0,narg,fill[1],cpat,xz[2];
00417   sciSubWindow * ppsubwin = pSUBWIN_FEATURE (psubwin);
00418   integer *tmpx = MALLOC(n2*sizeof(integer));
00419   integer *tmpy = MALLOC(n1*sizeof(integer));
00420
00421   for (i = 0 ; i < (n2) ; i++) tmpx[i] = x[i];
00422   for (i = 0 ; i < (n1) ; i++) tmpy[i] = y[i];
00423
00424   C2F(dr)("xget","pattern",&verbose,&cpat,&narg,PI0,PI0,PI0,PD0,PD0,PD0,PD0,0L,0L);
00425   C2F(dr)("xget","wdim",&verbose,xz,&narg, PI0, PI0,PI0,PD0,PD0,PD0,PD0,0L,0L);
00426   for (i = 0 ; i < (n1)-1 ; i++)
00427     for (j = 0 ; j < (n2)-1 ; j++)
00428       {
00429         integer w,h;
00430         int xx,yy;
00431         fill[0]= (integer) (z[i+(n1-1)*j]);
00432         C2F(dr)("xset","pattern",&(fill[0]),PI0,PI0,PI0,PI0,PI0,PD0,PD0,PD0,PD0,0L,0L);
00433
00434         w=Abs(tmpx[j+1]-tmpx[j]);
00435         h=Abs(tmpy[i+1]-tmpy[i]);
00436         /* We don't trace rectangle which are totally out **/
00437         if ( w != 0 && h != 0 && x[j] < xz[0] && y[i] < xz[1] && x[j]+w > 0 && y[i]+h > 0 )
00438           if ( Abs(x[j]) < int16max && Abs(y[i+1]) < int16max && w < uns16max && h < uns16max)
00439             {
00440               if(ppsubwin->axes.reverse[0] == TRUE)
00441                 xx = x[j] -w;
00442               else
00443                 xx = x[j];
00444
00445               if(ppsubwin->axes.reverse[1] == TRUE)
00446                 yy = y[i] -h;
00447               else
00448                 yy = y[i];
00449
00450               C2F(dr)("xfrect","v",&xx,&yy,&w,&h,PI0,PI0,PD0,PD0,PD0,PD0,0L,0L);
00451             }
00452         C2F(dr)("xset","pattern",&cpat,PI0,PI0,PI0,PI0,PI0,PD0,PD0,PD0,PD0,0L,0L);
00453       }
00454
00455
00456   FREE(tmpx); tmpx = NULL;
00457   FREE(tmpy); tmpy = NULL;
00458
00459 }
Here is the call graph for this function:

Here is the caller graph for this function:

| static void GraySquare_base | ( | integer * | x, | |
| integer * | y, | |||
| double * | z, | |||
| integer | n1, | |||
| integer | n2 | |||
| ) | [static] |
Definition at line 166 of file Gray.c.
References Abs, C2F, dr(), h, i, inint, int16max, j, L, Maxi(), Mini(), PD0, PI0, SMDOUBLE, uns16max, and w.
Referenced by GraySquare().
00167 {
00168   double zmoy,zmax,zmin,zmaxmin;
00169   integer i,j,verbose=0,whiteid,narg,fill[1],cpat,xz[2];
00170   zmin=Mini(z,(n1)*(n2));
00171   zmax=Maxi(z,(n1)*(n2));
00172   zmaxmin=zmax-zmin;
00173   if (zmaxmin <= SMDOUBLE) zmaxmin=SMDOUBLE;
00174   C2F(dr)("xget","lastpattern",&verbose,&whiteid,&narg,PI0,PI0,PI0,PD0,PD0,PD0,PD0,0L,0L);
00175   C2F(dr)("xget","pattern",&verbose,&cpat,&narg,PI0,PI0,PI0,PD0,PD0,PD0,PD0,0L,0L);
00176   C2F(dr)("xget","wdim",&verbose,xz,&narg, PI0, PI0,PI0,PD0,PD0,PD0,PD0,0L,0L);
00177
00178   for (i = 0 ; i < (n1)-1 ; i++)
00179     for (j = 0 ; j < (n2)-1 ; j++)
00180       {
00181         integer w,h;
00182         zmoy=1/4.0*(z[i+n1*j]+z[i+n1*(j+1)]+z[i+1+n1*j]+z[i+1+n1*(j+1)]);
00183         fill[0]=1 + inint((whiteid-1)*(zmoy-zmin)/(zmaxmin));
00184         if (x[n1] == 1) fill[0]= inint(z[j+ (i*n2)]); /* NG ????? */
00185         C2F(dr)("xset","pattern",&(fill[0]),PI0,PI0,PI0,PI0,PI0,PD0,PD0,PD0,PD0,0L,0L);
00186         w=Abs(x[i+1]-x[i]);h=Abs(y[j+1]-y[j]);
00187         /* We don't trace rectangle which are totally out **/
00188         if ( w != 0 && h != 0 && x[i] < xz[0] && y[j+1] < xz[1] && x[i]+w > 0 && y[j+1]+h > 0 )
00189           {
00190             if ( Abs(x[i]) < int16max && Abs(y[j+1]) < int16max && w < uns16max && h < uns16max)
00191               {
00192                 C2F(dr)("xfrect","v",&x[i],&y[j+1],&w,&h,PI0,PI0,PD0,PD0,PD0,PD0,0L,0L);
00193               }
00194             else
00195               {
00196                 /* fprintf(stderr,"Rectangle too large \n"); */
00197               }
00198           }
00199       }
00200
00201   C2F(dr)("xset","pattern",&cpat,PI0,PI0,PI0,PI0,PI0,PD0,PD0,PD0,PD0,0L,0L);
00202 }
Here is the call graph for this function:

Here is the caller graph for this function:

Definition at line 461 of file Gray.c.
References C2F, dr(), i, j, L, PD0, and PI0.
Referenced by drawGrayplotEntity().
00462 {
00463   integer i,j,verbose=0,whiteid,narg,fill,cpat,xz[2];
00464   integer vertexx[5], vertexy[5];
00465   int cinq = 5, un = 1;
00466
00467   int *xm = x;
00468   int *ym = y;
00469
00470   C2F(dr)("xget","lastpattern",&verbose,&whiteid,&narg,PI0,PI0,PI0,PD0,PD0,PD0,PD0,0L,0L);
00471   C2F(dr)("xget","pattern",&verbose,&cpat,&narg,PI0,PI0,PI0,PD0,PD0,PD0,PD0,0L,0L);
00472   C2F(dr)("xget","wdim",&verbose,xz,&narg, PI0, PI0,PI0,PD0,PD0,PD0,PD0,0L,0L);
00473
00474   for (i = 0 ; i < (n1)-1 ; i++)
00475     for (j = 0 ; j < (n2)-1 ; j++)
00476       {
00477         fill= - (int) z[j+n1*i];
00478         C2F(dr)("xset","pattern",&fill,PI0,PI0,PI0,PI0,PI0,PD0,PD0,PD0,PD0,0L,0L);
00479
00480         vertexx[0] = xm[i+n1*j];
00481         vertexx[1] = xm[i+n1*(j+1)];
00482         vertexx[2] = xm[i+1+n1*(j+1)];
00483         vertexx[3] = xm[i+1+n1*j];
00484         vertexx[4] = xm[i+n1*j];
00485
00486         vertexy[0] = ym[j+n2*i];
00487         vertexy[1] = ym[j+1+n2*i];
00488         vertexy[2] = ym[j+1+n2*(i+1)];
00489         vertexy[3] = ym[j+n2*(i+1)];
00490         vertexy[4] = ym[j+n2*i];
00491
00492         C2F(dr)("xliness","str",vertexx,vertexy,&fill,&un,&cinq,
00493                 PI0,PD0,PD0,PD0,PD0,0L,0L);
00494       }
00495
00496   C2F(dr)("xset","pattern",&cpat,PI0,PI0,PI0,PI0,PI0,PD0,PD0,PD0,PD0,0L,0L);
00497 }
Here is the call graph for this function:

Here is the caller graph for this function:

Definition at line 501 of file Gray.c.
References C2F, dr(), i, inint, j, L, Maxi(), Mini(), PD0, PI0, and SMDOUBLE.
Referenced by drawGrayplotEntity().
00502 {
00503   double zmoy,zmax,zmin,zmaxmin;
00504   integer i,j,verbose=0,whiteid,narg,fill,cpat,xz[2];
00505   integer vertexx[5], vertexy[5];
00506   int cinq = 5, un = 1;
00507
00508   int *xm = x;
00509   int *ym = y;
00510
00511   zmin=Mini(z,(n1)*(n2));
00512   zmax=Maxi(z,(n1)*(n2));
00513   zmaxmin=zmax-zmin;
00514   if (zmaxmin <= SMDOUBLE) zmaxmin=SMDOUBLE;
00515
00516   C2F(dr)("xget","lastpattern",&verbose,&whiteid,&narg,PI0,PI0,PI0,PD0,PD0,PD0,PD0,0L,0L);
00517   C2F(dr)("xget","pattern",&verbose,&cpat,&narg,PI0,PI0,PI0,PD0,PD0,PD0,PD0,0L,0L);
00518   C2F(dr)("xget","wdim",&verbose,xz,&narg, PI0, PI0,PI0,PD0,PD0,PD0,PD0,0L,0L);
00519
00520   for (i = 0 ; i < (n1)-1 ; i++)
00521     for (j = 0 ; j < (n2)-1 ; j++)
00522       {
00523         zmoy=1/4.0*(z[i+n1*j]+z[i+n1*(j+1)]+z[i+1+n1*j]+z[i+1+n1*(j+1)]);
00524         fill= - (1 + inint((whiteid-1)*(zmoy-zmin)/(zmaxmin)));
00525
00526         C2F(dr)("xset","pattern",&fill,PI0,PI0,PI0,PI0,PI0,PD0,PD0,PD0,PD0,0L,0L);
00527
00528         vertexx[0] = xm[i+n1*j];
00529         vertexx[1] = xm[i+n1*(j+1)];
00530         vertexx[2] = xm[i+1+n1*(j+1)];
00531         vertexx[3] = xm[i+1+n1*j];
00532         vertexx[4] = xm[i+n1*j];
00533
00534         vertexy[0] = ym[j+n2*i];
00535         vertexy[1] = ym[j+1+n2*i];
00536         vertexy[2] = ym[j+1+n2*(i+1)];
00537         vertexy[3] = ym[j+n2*(i+1)];
00538         vertexy[4] = ym[j+n2*i];
00539
00540         C2F(dr)("xliness","str",vertexx,vertexy,&fill,&un,&cinq,
00541                 PI0,PD0,PD0,PD0,PD0,0L,0L);
00542       }
00543
00544   C2F(dr)("xset","pattern",&cpat,PI0,PI0,PI0,PI0,PI0,PD0,PD0,PD0,PD0,0L,0L);
00545 }
Here is the call graph for this function:

Here is the caller graph for this function:

| void initsubwin | ( | ) |
Definition at line 431 of file InitObjects.c.
00432 {
00433   sciPointObj  * psubwin  ;
00434   sciSubWindow * ppSubWin ;
00435
00436
00437   Cscale2default();
00438   psubwin = sciGetCurrentSubWin();
00439   ppSubWin = pSUBWIN_FEATURE (psubwin) ;
00440
00441
00442   initSubWinSize( psubwin  ) ;
00443
00444   clearUserData( psubwin ) ;
00445
00446   reinitSubWin( psubwin ) ;
00447
00448   (ppSubWin->axes).axes_visible[0] = FALSE;
00449   (ppSubWin->axes).axes_visible[1] = FALSE;
00450   (ppSubWin->axes).axes_visible[2] = FALSE;
00451
00452   (ppSubWin->axes).reverse[0] = FALSE;
00453   (ppSubWin->axes).reverse[1] = FALSE;
00454   (ppSubWin->axes).reverse[2] = FALSE;
00455
00456   ppSubWin->axes.rect = BT_OFF;
00457   ppSubWin->axes.ticscolor = -1;
00458   ppSubWin->axes.subint[0] =  1;
00459   ppSubWin->axes.subint[1] =  1;
00460   ppSubWin->axes.subint[2] =  1;
00461   ppSubWin->axes.limits[0]  = 0;
00462
00463 }
| int re_index_brect | ( | double * | brect, | |
| double * | drect | |||
| ) |
| BOOL strflag2axes_properties | ( | sciPointObj * | psubwin, | |
| char * | strflag | |||
| ) |
| BOOL update_specification_bounds | ( | sciPointObj * | psubwin, | |
| double * | rect, | |||
| int | flag | |||
| ) |
| int C2F() xgray | ( | double * | x, | |
| double * | y, | |||
| double * | z, | |||
| integer * | n1, | |||
| integer * | n2, | |||
| char * | strflag, | |||
| double * | brect, | |||
| integer * | aaint, | |||
| BOOL | flagNax, | |||
| long int | l1 | |||
| ) |
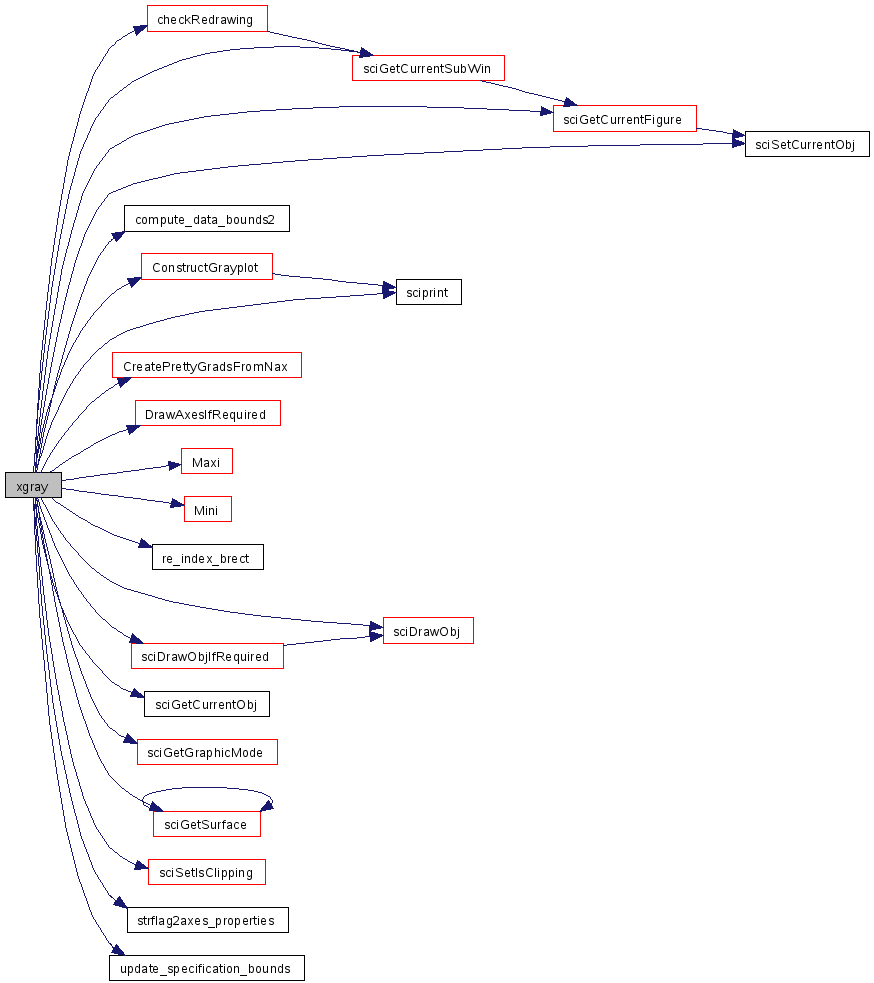
z : is the value of a function on the grid defined by x,y on each rectangle the average value of z is computed and [zmin,zmax] is linearly remapped to the [colormin,colormap] values of colors in the current colormap the color associated to zmoy is used for filling a specific rectangle
Definition at line 54 of file Gray.c.
References checkRedrawing(), compute_data_bounds2(), ConstructGrayplot(), CreatePrettyGradsFromNax(), DrawAxesIfRequired(), FALSE, Max, Maxi(), Min, Mini(), NULL, pSUBWIN_FEATURE, re_index_brect(), sciDrawObj(), sciDrawObjIfRequired(), sciGetCurrentFigure(), sciGetCurrentObj(), sciGetCurrentSubWin(), sciGetGraphicMode(), sciGetSurface(), sciprint(), sciSetCurrentObj(), sciSetIsClipping(), strflag2axes_properties(), TRUE, update_specification_bounds(), and x.
Referenced by Objgrayplot().
00055 {
00056   double xx[2],yy[2];
00057   integer nn1=1,nn2=2;
00058   sciPointObj  *psubwin = NULL;
00059   double drect[6];
00060   BOOL bounds_changed = FALSE;
00061   BOOL isRedrawn ;
00062   BOOL axes_properties_changed = FALSE;
00063
00064   xx[0]=Mini(x,*n1);xx[1]=Maxi(x,*n1);
00065   yy[0]=Mini(y,*n2);yy[1]=Maxi(y,*n2);
00066
00067
00068   /* Adding F.Leray 22.04.04 */
00069   psubwin = sciGetCurrentSubWin();
00070
00071   isRedrawn = checkRedrawing() ;
00072
00073   /* Force psubwin->is3d to FALSE: we are in 2D mode */
00074   if (sciGetSurface(psubwin) == (sciPointObj *) NULL)
00075   {
00076     pSUBWIN_FEATURE (psubwin)->is3d = FALSE;
00077     pSUBWIN_FEATURE (psubwin)->project[2]= 0;
00078   }
00079   else
00080   {
00081     pSUBWIN_FEATURE (psubwin)->theta_kp=pSUBWIN_FEATURE (psubwin)->theta;
00082     pSUBWIN_FEATURE (psubwin)->alpha_kp=pSUBWIN_FEATURE (psubwin)->alpha;
00083   }
00084
00085   pSUBWIN_FEATURE (psubwin)->alpha  = 0.0;
00086   pSUBWIN_FEATURE (psubwin)->theta  = 270.0;
00087
00088   /* Force psubwin->axes.aaint to those given by argument aaint*/
00089   /*****TO CHANGE F.Leray 10.09.04  for (i=0;i<4;i++) pSUBWIN_FEATURE(psubwin)->axes.aaint[i] = aaint[i]; */
00090
00091   /* Force "cligrf" clipping */
00092   sciSetIsClipping (psubwin,0);
00093
00094
00095   if (sciGetGraphicMode (psubwin)->autoscaling) {
00096     /* compute and merge new specified bounds with psubwin->Srect */
00097     switch (strflag[1])  {
00098       case '0':
00099         /* do not change psubwin->Srect */
00100         break;
00101       case '1' : case '3' : case '5' : case '7':
00102         /* Force psubwin->Srect=brect */
00103         re_index_brect(brect, drect);
00104         break;
00105       case '2' : case '4' : case '6' : case '8': case '9':
00106         /* Force psubwin->Srect to the x and y bounds */
00107         /* compute_data_bounds(0,'g',xx,yy,nn1,nn2,drect); */
00108         compute_data_bounds2(0,'g',pSUBWIN_FEATURE(psubwin)->logflags,xx,yy,nn1,nn2,drect);
00109         break;
00110     }
00111     if (!pSUBWIN_FEATURE(psubwin)->FirstPlot &&(strflag[1] == '7' || strflag[1] == '8')) { /* merge psubwin->Srect and drect */
00112       drect[0] = Min(pSUBWIN_FEATURE(psubwin)->SRect[0],drect[0]); /*xmin*/
00113       drect[2] = Min(pSUBWIN_FEATURE(psubwin)->SRect[2],drect[2]); /*ymin*/
00114       drect[1] = Max(pSUBWIN_FEATURE(psubwin)->SRect[1],drect[1]); /*xmax*/
00115       drect[3] = Max(pSUBWIN_FEATURE(psubwin)->SRect[3],drect[3]); /*ymax*/
00116     }
00117     if (strflag[1] != '0')
00118       bounds_changed = update_specification_bounds(psubwin, drect,2);
00119   }
00120
00121   if(pSUBWIN_FEATURE (psubwin)->FirstPlot == TRUE) bounds_changed = TRUE;
00122
00123   axes_properties_changed = strflag2axes_properties(psubwin, strflag);
00124
00125   pSUBWIN_FEATURE (psubwin)->FirstPlot = FALSE; /* just after strflag2axes_properties */
00126
00127   /* F.Leray 07.10.04 : trigger algo to init. manual graduation u_xgrads and
00128   u_ygrads if nax (in matdes.c which is == aaint HERE) was specified */
00129
00130   pSUBWIN_FEATURE (psubwin)->flagNax = flagNax; /* store new value for flagNax */
00131
00132   if(pSUBWIN_FEATURE (psubwin)->flagNax == TRUE){
00133     if(pSUBWIN_FEATURE (psubwin)->logflags[0] == 'n' && pSUBWIN_FEATURE (psubwin)->logflags[1] == 'n')
00134     {
00135       pSUBWIN_FEATURE (psubwin)->axes.auto_ticks[0] = FALSE; /* x and y graduations are imposed by Nax */
00136       pSUBWIN_FEATURE (psubwin)->axes.auto_ticks[1] = FALSE;
00137
00138       CreatePrettyGradsFromNax(psubwin,aaint);
00139     }
00140     else{
00141       sciprint("Warning : Nax does not work with logarithmic scaling\n");}
00142   }
00143
00144   if(bounds_changed == TRUE || axes_properties_changed == TRUE)
00145     sciDrawObj(sciGetCurrentFigure());
00146
00147   sciSetCurrentObj (ConstructGrayplot
00148     ((sciPointObj *)
00149     sciGetCurrentSubWin(),
00150     x,y,z,*n1,*n2,0));
00151   /* if the auto_clear is on we must redraw everything */
00152   if ( isRedrawn )
00153   {
00154     sciDrawObjIfRequired( sciGetCurrentFigure() ) ;
00155   }
00156   else
00157   {
00158     sciDrawObjIfRequired(sciGetCurrentObj ());
00159     DrawAxesIfRequired(sciGetCurrentObj ()); /* force axes redrawing */
00160   }
00161
00162   return(0);
00163 }
Here is the call graph for this function:
Here is the caller graph for this function:

| int C2F() xgray1 | ( | double * | z, | |
| integer * | n1, | |||
| integer * | n2, | |||
| char * | strflag, | |||
| double * | brect, | |||
| integer * | aaint, | |||
| BOOL | flagNax, | |||
| long int | l1 | |||
| ) |
Matplot subroutine z : of size n1*n2 the z value is interpreted as a color number inside the current colormap z[i,j] is used as the color of a square [i-0.5,i+0.5] [j-0.5,j+0.5]
Definition at line 217 of file Gray.c.
References checkRedrawing(), compute_data_bounds2(), ConstructGrayplot(), CreatePrettyGradsFromNax(), DrawAxesIfRequired(), FALSE, Max, Min, NULL, pSUBWIN_FEATURE, re_index_brect(), sciDrawObj(), sciDrawObjIfRequired(), sciGetCurrentFigure(), sciGetCurrentObj(), sciGetCurrentSubWin(), sciGetGraphicMode(), sciGetSurface(), sciprint(), sciSetCurrentObj(), strflag2axes_properties(), TRUE, and update_specification_bounds().
Referenced by Objmatplot().
00218 {
00219   double xx[2],yy[2];
00220   static integer nn1=1,nn2=2;
00221   sciPointObj  *psubwin = NULL;
00222   double drect[6];
00223   BOOL bounds_changed = FALSE;
00224   BOOL axes_properties_changed = FALSE;
00225   BOOL isRedrawn ;
00226
00227   xx[0]=0.5;xx[1]= *n2+0.5;
00228   yy[0]=0.5;yy[1]= *n1+0.5;
00229
00230   /* Adding F.Leray 22.04.04 */
00231   psubwin = sciGetCurrentSubWin();
00232
00233   isRedrawn = checkRedrawing() ;
00234
00235   /* Force psubwin->is3d to FALSE: we are in 2D mode */
00236   if (sciGetSurface(psubwin) == (sciPointObj *) NULL)
00237   {
00238     pSUBWIN_FEATURE (psubwin)->is3d = FALSE;
00239     pSUBWIN_FEATURE (psubwin)->project[2]= 0;
00240   }
00241   else
00242   {
00243     pSUBWIN_FEATURE (psubwin)->theta_kp=pSUBWIN_FEATURE (psubwin)->theta;
00244     pSUBWIN_FEATURE (psubwin)->alpha_kp=pSUBWIN_FEATURE (psubwin)->alpha;
00245   }
00246
00247   pSUBWIN_FEATURE (psubwin)->alpha  = 0.0;
00248   pSUBWIN_FEATURE (psubwin)->theta  = 270.0;
00249
00250   /*****TO CHANGE F.Leray 10.09.04    for (i=0;i<4;i++)     pSUBWIN_FEATURE(psubwin)->axes.aaint[i] = aaint[i]; */
00251
00252   /*---- Boundaries of the frame ----*/
00253   if (sciGetGraphicMode (psubwin)->autoscaling){
00254     /* compute and merge new specified bounds with psubwin->Srect */
00255     switch (strflag[1])  {
00256     case '0':
00257       /* do not change psubwin->Srect */
00258       break;
00259     case '1' : case '3' : case '5' : case '7':
00260       /* Force psubwin->Srect=brect */
00261       re_index_brect(brect, drect);
00262       break;
00263     case '2' : case '4' : case '6' : case '8': case '9':
00264       /* Force psubwin->Srect to the x and y bounds */
00265       /*        compute_data_bounds(0,'g',xx,yy,nn1,nn2,drect); */
00266       compute_data_bounds2(0,'g',pSUBWIN_FEATURE(psubwin)->logflags,xx,yy,nn1,nn2,drect);
00267       break;
00268     }
00269     if (!pSUBWIN_FEATURE(psubwin)->FirstPlot &&
00270       (strflag[1] == '7' || strflag[1] == '8' || strflag[1] == '9')) { /* merge psubwin->Srect and drect */
00271         drect[0] = Min(pSUBWIN_FEATURE(psubwin)->SRect[0],drect[0]); /*xmin*/
00272         drect[2] = Min(pSUBWIN_FEATURE(psubwin)->SRect[2],drect[2]); /*ymin*/
00273         drect[1] = Max(pSUBWIN_FEATURE(psubwin)->SRect[1],drect[1]); /*xmax*/
00274         drect[3] = Max(pSUBWIN_FEATURE(psubwin)->SRect[3],drect[3]); /*ymax*/
00275     }
00276     if (strflag[1] != '0')
00277       bounds_changed = update_specification_bounds(psubwin, drect,2);
00278   }
00279
00280   if(pSUBWIN_FEATURE (psubwin)->FirstPlot == TRUE) bounds_changed = TRUE;
00281
00282   axes_properties_changed = strflag2axes_properties(psubwin, strflag);
00283
00284   pSUBWIN_FEATURE (psubwin)->FirstPlot = FALSE; /* just after strflag2axes_properties */
00285
00286   /* F.Leray 07.10.04 : trigger algo to init. manual graduation u_xgrads and
00287   u_ygrads if nax (in matdes.c which is == aaint HERE) was specified */
00288
00289   pSUBWIN_FEATURE(psubwin)->flagNax = flagNax; /* store new value for flagNax */
00290
00291   if(pSUBWIN_FEATURE(psubwin)->flagNax == TRUE){
00292     if(pSUBWIN_FEATURE(psubwin)->logflags[0] == 'n' && pSUBWIN_FEATURE(psubwin)->logflags[1] == 'n')
00293     {
00294       pSUBWIN_FEATURE(psubwin)->axes.auto_ticks[0] = FALSE; /* x and y graduations are imposed by Nax */
00295       pSUBWIN_FEATURE(psubwin)->axes.auto_ticks[1] = FALSE;
00296
00297       CreatePrettyGradsFromNax(psubwin,aaint);
00298     }
00299     else{
00300       sciprint("Warning : Nax does not work with logarithmic scaling\n");}
00301   }
00302
00303
00304
00305   if(bounds_changed == TRUE || axes_properties_changed == TRUE)
00306     sciDrawObj(sciGetCurrentFigure());
00307
00308   sciSetCurrentObj (ConstructGrayplot
00309     ((sciPointObj *)
00310     sciGetCurrentSubWin(),
00311     NULL,NULL,z,*n1 + 1,*n2 + 1,1));
00312   /* if the auto_clear is on we must redraw everything */
00313   if ( isRedrawn )
00314   {
00315     sciDrawObjIfRequired( sciGetCurrentFigure() ) ;
00316   }
00317   else
00318   {
00319     sciDrawObjIfRequired(sciGetCurrentObj ());
00320     DrawAxesIfRequired(sciGetCurrentObj ()); /* force axes redrawing */
00321   }
00322
00323   return (0);
00324 }
Here is the call graph for this function:

Here is the caller graph for this function:

like xgray1 : but xrect here give the rectangle in which the grayplot is to be drawn using the current scale
Definition at line 333 of file Gray.c.
References checkRedrawing(), ConstructGrayplot(), DrawAxesIfRequired(), NULL, sciDrawObj(), sciDrawObjIfRequired(), sciGetCurrentFigure(), sciGetCurrentObj(), sciGetCurrentSubWin(), sciSetCurrentObj(), and sciSetIsClipping().
Referenced by Objmatplot1().
00334 {
00335
00336   BOOL isRedrawn ;
00337   double y; /* void for ConstructGrayplot */
00338   sciPointObj *psubwin = NULL;
00339
00340   isRedrawn = checkRedrawing() ;
00341
00342   /*---- Boundaries of the frame ----*/
00343   psubwin = sciGetCurrentSubWin();
00344   sciSetIsClipping (psubwin,0);
00345
00346   sciDrawObj(psubwin);
00347   sciSetCurrentObj (ConstructGrayplot
00348     ((sciPointObj *)
00349     sciGetCurrentSubWin(),
00350     xrect,&y,z,*n1+1,*n2+1,2));
00351   /* if the auto_clear is on we must redraw everything */
00352   if ( isRedrawn )
00353   {
00354     sciDrawObjIfRequired( sciGetCurrentFigure() ) ;
00355   }
00356   else
00357   {
00358     sciDrawObjIfRequired(sciGetCurrentObj ());
00359     DrawAxesIfRequired(sciGetCurrentObj ()); /* force axes redrawing */
00360   }
00361
00362
00363   return (0);
00364 }
Here is the call graph for this function:

Here is the caller graph for this function:

 1.5.1
1.5.1