


Next: About this document ...
Up: Scicos
Previous: Hybrid controler
Here we show the Scicos diagram of a simplified
thermostated temperature regulation. Constant blocks with value 10 and
-10 represent the upper and lower temperature bounds, while constant
blocks with value 6 and -6 represent heating (cooling) power.
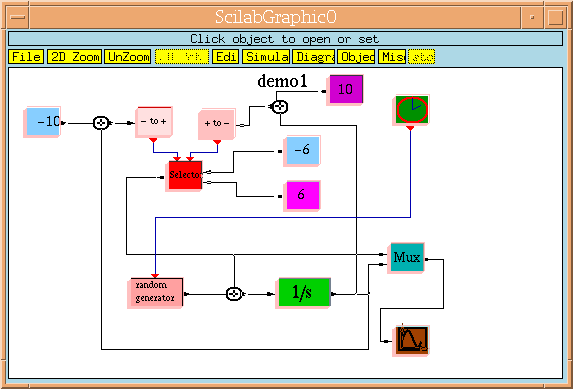
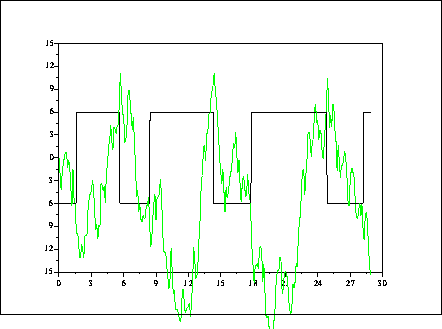
Simulation results in the following plot:
Scilab group