Next:
grayplot of a surface
Up:
2D and 3D plotting
Previous:
Contour plot of a
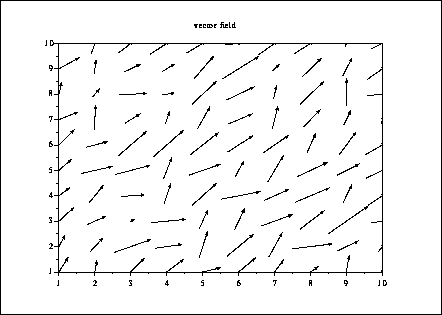
Drawing vector field
champ(1:10,1:10,rand(10,10),rand(10,10),1.0);
xtitle('vector field',' ',' ');
Scilab group