The goal of rawKS is to easily extract the raw KS statistics to plot and report. The Python version pyks is hosted from GitHub.
The development version from GitHub with:
# install.packages("devtools")
devtools::install_github("JiaxiangBU/rawKS")library(tidyverse)
#> Registered S3 methods overwritten by 'ggplot2':
#> method from
#> [.quosures rlang
#> c.quosures rlang
#> print.quosures rlang
#> ── Attaching packages ───────────────────────────────────────────────────────── tidyverse 1.2.1 ──
#> <U+2713> ggplot2 3.1.1 <U+2713> purrr 0.3.3
#> <U+2713> tibble 2.1.3 <U+2713> dplyr 0.8.3
#> <U+2713> tidyr 0.8.3 <U+2713> stringr 1.4.0
#> <U+2713> readr 1.3.1 <U+2713> forcats 0.4.0
#> Warning: package 'purrr' was built under R version 3.6.1
#> Warning: package 'dplyr' was built under R version 3.6.1
#> ── Conflicts ──────────────────────────────────────────────────────────── tidyverse_conflicts() ──
#> x dplyr::filter() masks stats::filter()
#> x dplyr::lag() masks stats::lag()
library(rawKS)
data("two_class_example_edited")
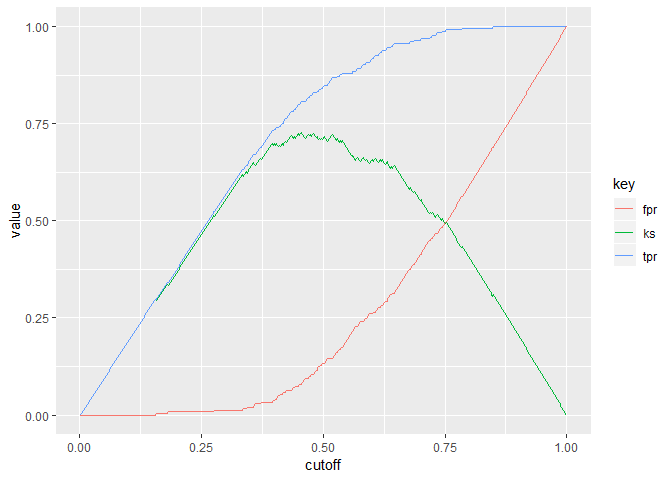
max(ks_table(two_class_example_edited$yhat, two_class_example_edited$y)$ks)
#> [1] 0.7276892
ks_table(two_class_example_edited$yhat, two_class_example_edited$y) %>%
ks_plot()