![]()
![]()
{flexFitR} is an R package designed for efficient
modeling and analysis of large and complex datasets. It offers powerful
tools for parameter estimation, model fitting, and visualization,
leveraging the {optimx} package for optimization and the
{future} package for parallel processing.
Install released version from CRAN:
install.packages("flexFitR")You can also install the development version of flexFitR from GitHub with:
# install.packages("devtools")
devtools::install_github("AparicioJohan/flexFitR"){optimx} algorithms to
solve and estimate parameters for a given function.{future} package, enabling efficient fitting of hundreds of
curves simultaneously.Here’s a simple example to get you started with
{flexFitR}. This example demonstrates fitting a piecewise
regression model:
library(flexFitR)

dt <- data.frame(
  time = c(0, 29, 36, 42, 56, 76, 92, 100, 108),
  variable = c(0, 0, 0.67, 15.11, 77.38, 99.81, 99.81, 99.81, 99.81)
)
plot(explorer(dt, time, variable), type = "xy")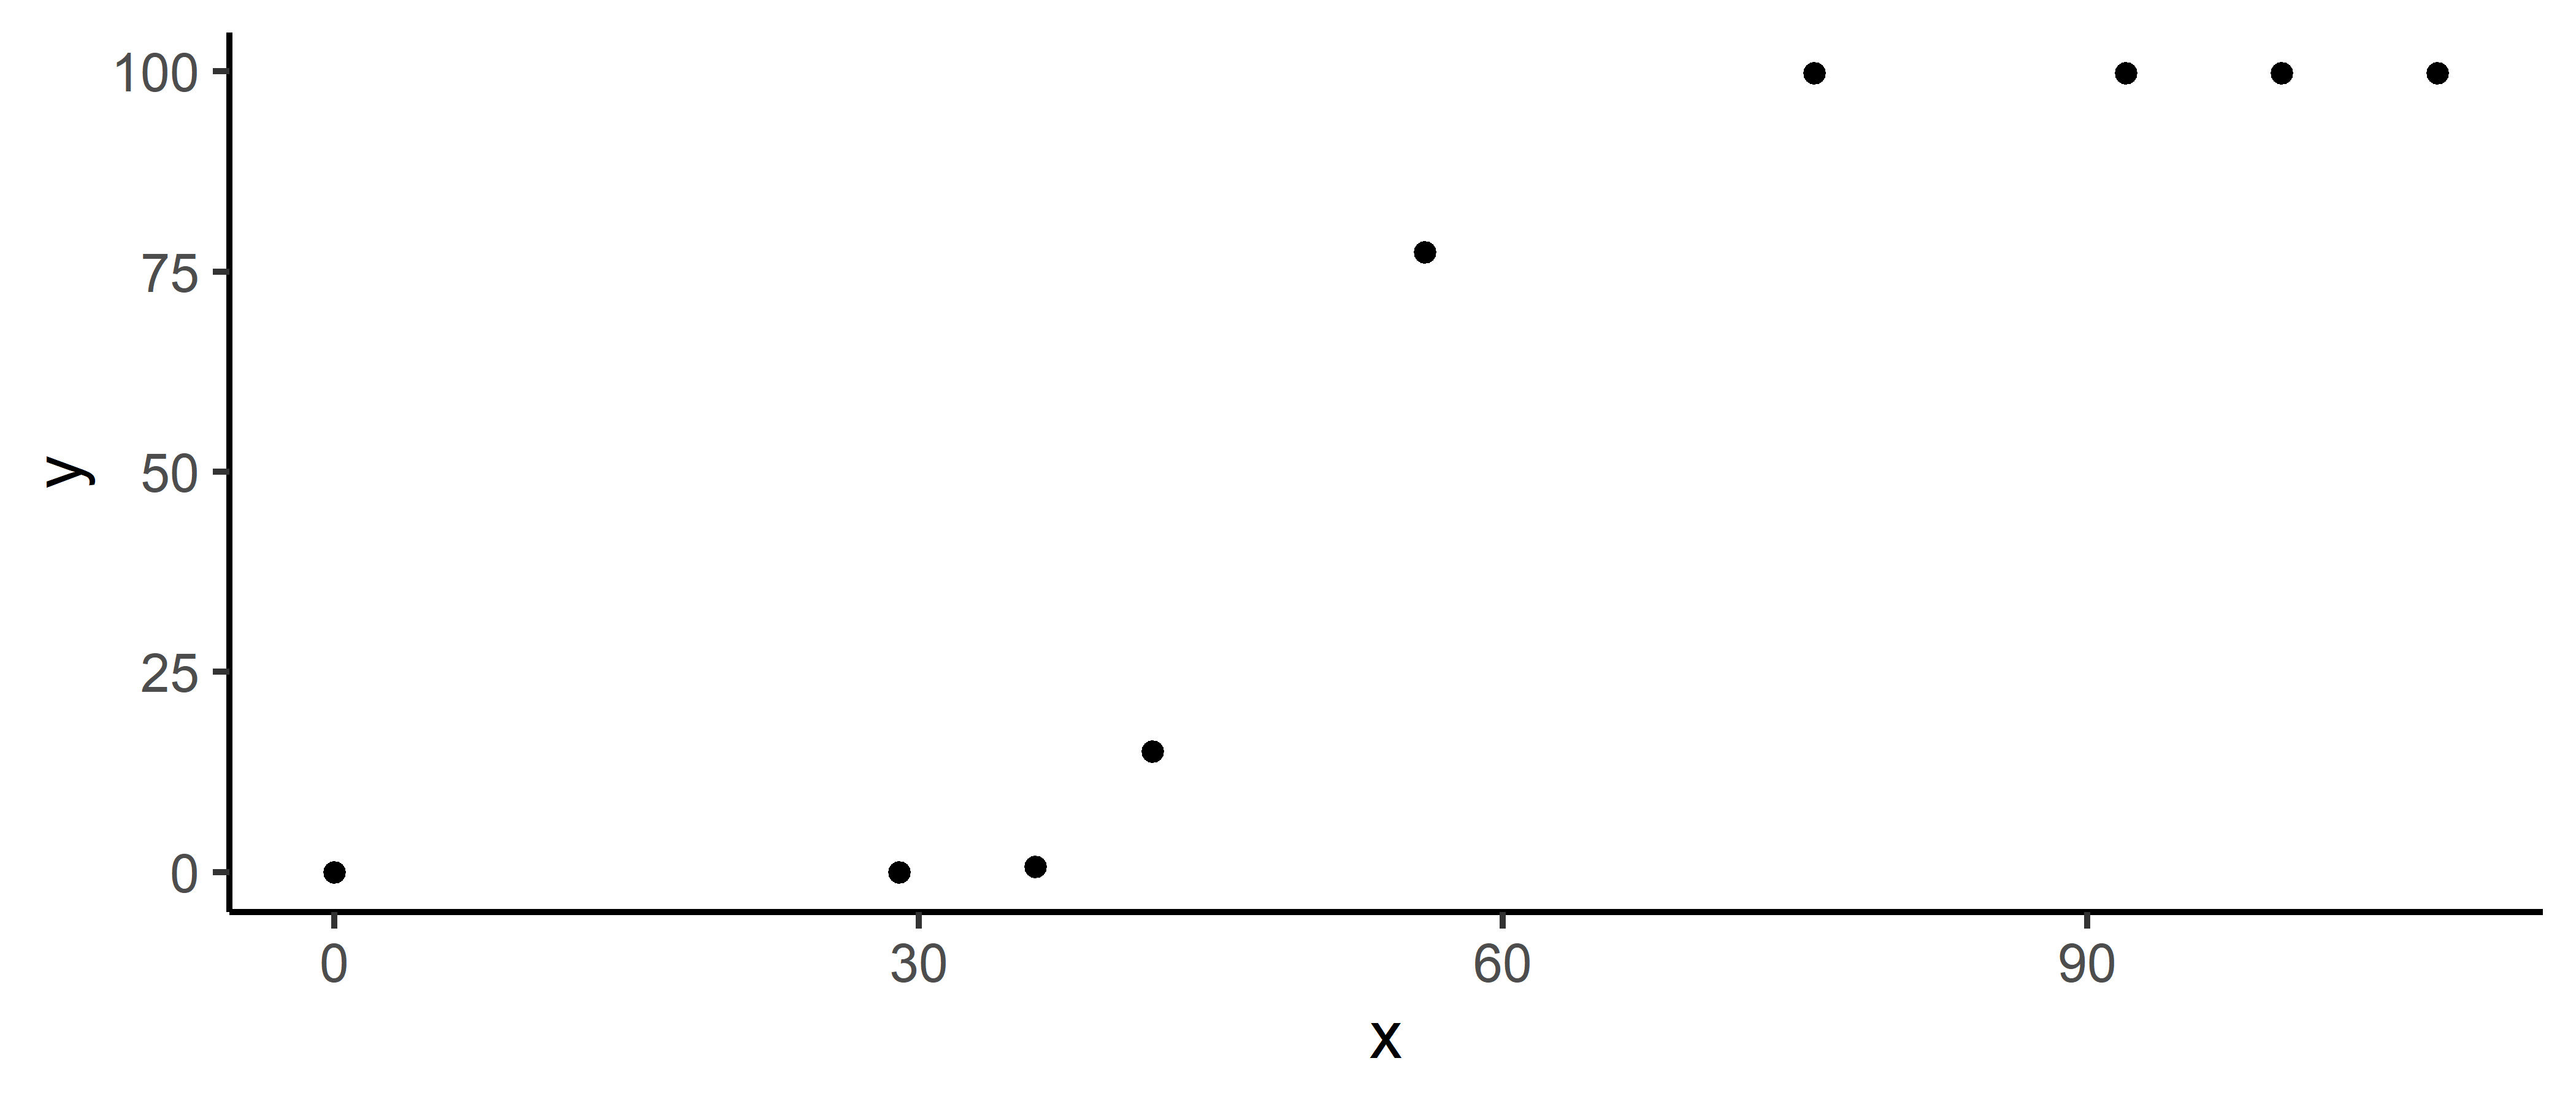
fn_lin_plat <- function(t, t1 = 45, t2 = 80, k = 0.9) {
  ifelse(
    test = t < t1,
    yes = 0,
    no = ifelse(t >= t1 & t <= t2, k / (t2 - t1) * (t - t1), k)
  )
}
# Fitting a linear plateau function
mod_1 <- dt |>
modeler(
x = time,
y = variable,
fn = "fn_lin_plat",
parameters = c(t1 = 45, t2 = 80, k = 90)
)print(mod_1)
Call:
variable ~ fn_lin_plat(time, t1, t2, k)
Residuals (`Standardized`):
Min. 1st Qu. Median Mean 3rd Qu. Max.
0.0000 0.0000 0.0000 0.2722 0.0000 2.4495
Optimization Results `head()`:
uid t1 t2 k sse
1 38.6 61 99.8 0.449
Metrics:
Groups Timing Convergence Iterations
1 0.1081 secs 100% 511 (id)# Auto plot
plot(mod_1)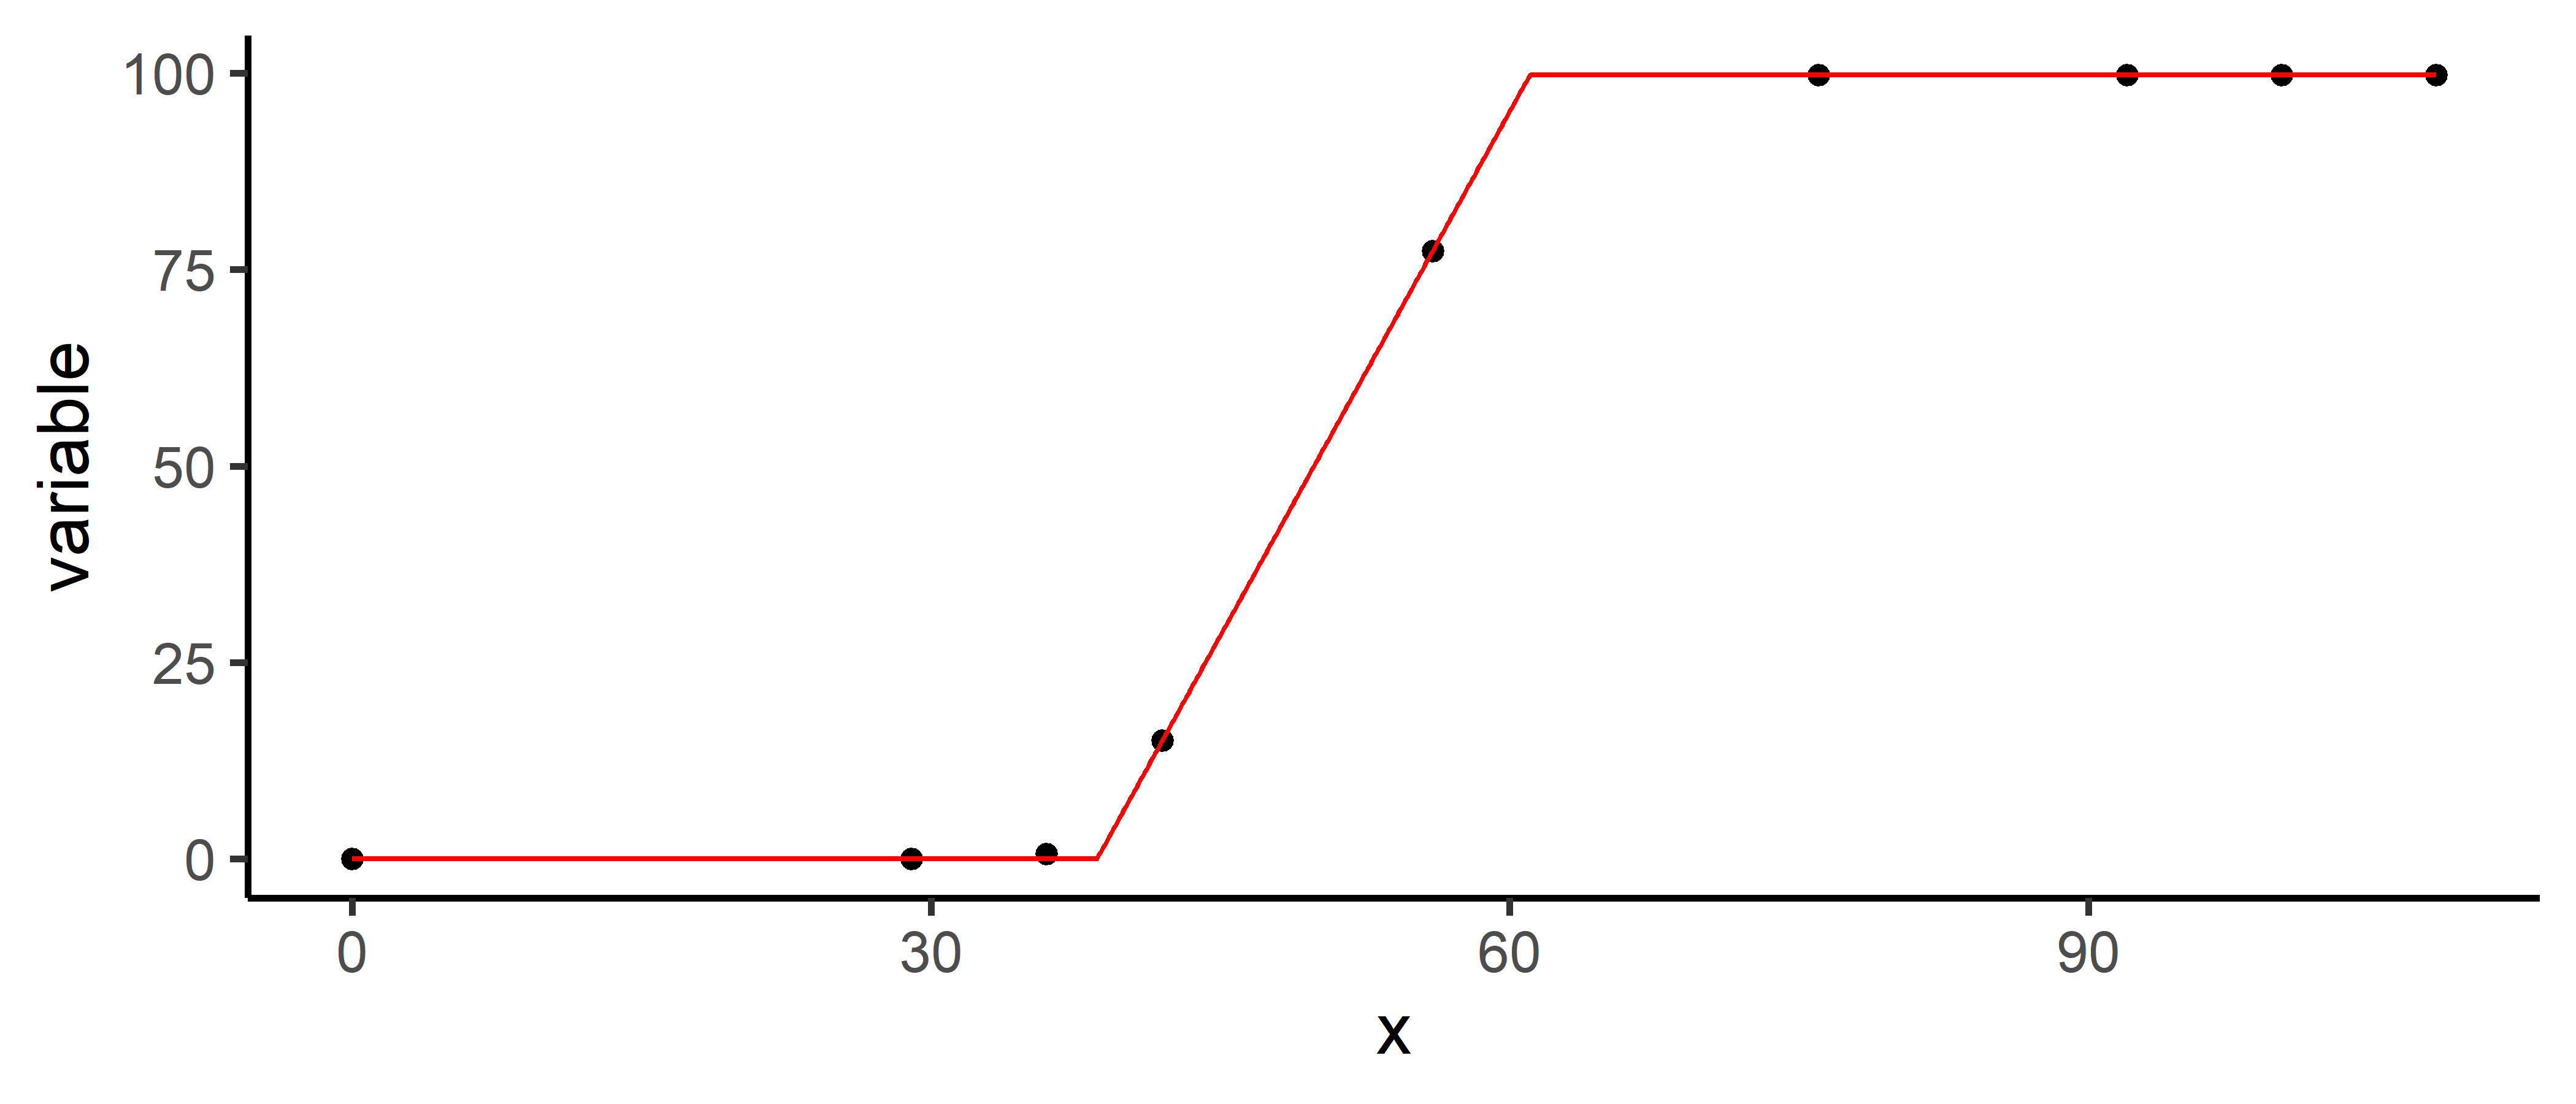
# Coefficients
coef(mod_1)
# A tibble: 3 × 7
    uid fn_name     coefficient solution std.error `t value` `Pr(>|t|)`
  <dbl> <chr>       <chr>          <dbl>     <dbl>     <dbl>      <dbl>
1     1 fn_lin_plat t1              38.6    0.0779      496.   4.54e-15
2     1 fn_lin_plat t2              61.0    0.0918      665.   7.82e-16
3     1 fn_lin_plat k               99.8    0.137       730.   4.47e-16
# Variance-Covariance Matrix
vcov(mod_1)
$`1`
t1 t2 k
t1 6.061705e-03 -0.002940001 1.877072e-07
t2 -2.940001e-03 0.008431400 4.204939e-03
k 1.877072e-07 0.004204939 1.870426e-02
attr(,"fn_name")
[1] "fn_lin_plat"# Making predictions
predict(mod_1, x = 45)
# A tibble: 1 × 5
uid fn_name x_new predicted.value std.error
<dbl> <chr> <dbl> <dbl> <dbl>
1 1 fn_lin_plat 45 28.5 0.223For detailed documentation and examples, visit flexFitR
Contributions to flexFitR are welcome! If you’d like to contribute, please fork the repository and submit a pull request. For significant changes, please open an issue first to discuss your ideas.
Please note that the flexFitR project is released with a Contributor Code of Conduct. By contributing to this project, you agree to abide by its terms.
flexFitR is licensed under the MIT License. See the LICENSE file for more details.