clustringr clusters a vector of strings into groups of
small mutual “edit distance” (see stringdist), using graph
algorithms. Notice it’s unsupervised, i.e., you do not need to
pre-specify cluster count. Graph visualization of the results is
provided.
Currently a development version is available on github.
# install.packages('devtools')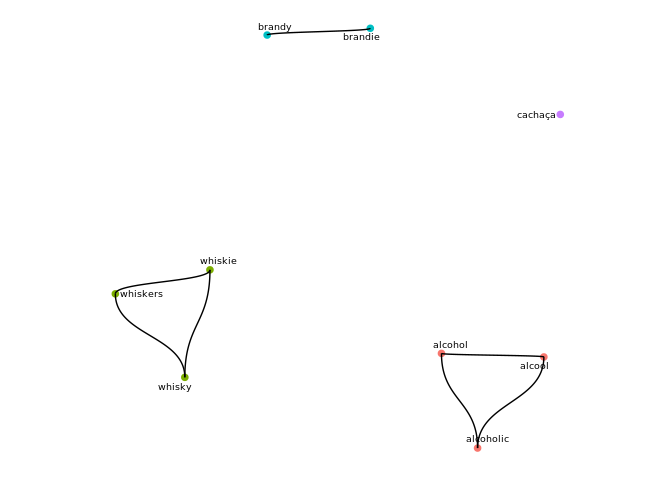
devtools::install_github('dan-reznik/clustringr')In the example below a vector of 9 strings is clustered into 4 groups
by levenshtein distance and connected components. The call to
cluster_strings() returns a list w/ 3 elements, the last of
which is df_clusters which associates to every input string
a cluster, along with its cluster size.
library(clustringr)
s_vec <- c("alcool",
           "alcohol",
           "alcoholic",
           "brandy",
           "brandie",
           "cachaça",
           "whisky",
           "whiskie",
           "whiskers")
s_clust <- cluster_strings(s_vec # input vector
                           ,clean=T # dedup and squish
                           ,method="lv" # levenshtein
                           # use: method="dl" (dam-lev) or "osa" for opt-seq-align
                           ,max_dist=3 # max edit distance for neighbors
                           ,algo="cc" # connected components
                           # use algo="eb" for edge-betweeness
)
s_clust$df_clusters
#> # A tibble: 9 x 3
#>   cluster  size node
#>     <int> <int> <chr>
#> 1       1     3 alcohol
#> 2       1     3 alcoholic
#> 3       1     3 alcool
#> 4       2     3 whiskers
#> 5       2     3 whiskie
#> 6       2     3 whisky
#> 7       3     2 brandie
#> 8       3     2 brandy
#> 9 4 1 cachaçaTo view a graph of the clusters, simply pass the structure returned
by cluster_strings to cluster_plot:
cluster_plot(s_clust
             ,min_cluster_size=1
             # ,label_size=2.5 # size of node labels
             # ,repel=T # whether labels should be repelled
             )
#> Using `nicely` as default layout
The clustringr package comes with
quijote_words, a ~22k row data frame of the unique words
(in Spanish) in Miguel de Cervantes’ “Don Quijote”. Full text can be
obtained here.
Let’s sample these words into a smaller subset:
library(dplyr)
quijote_words_sampled <- clustringr::quijote_words %>%
  filter(between(freq,8,11),len>6) %>%
  pull("word")
quijote_words_sampled%>%length
#> [1] 602
Now let’s cluster these and view the results as a graph-plot, showing only those clusters with at least 3 elements:
quijote_words_sampled %>%
  cluster_strings(method="lv",max_dist=2) %>%
  cluster_plot(min_cluster_size=3)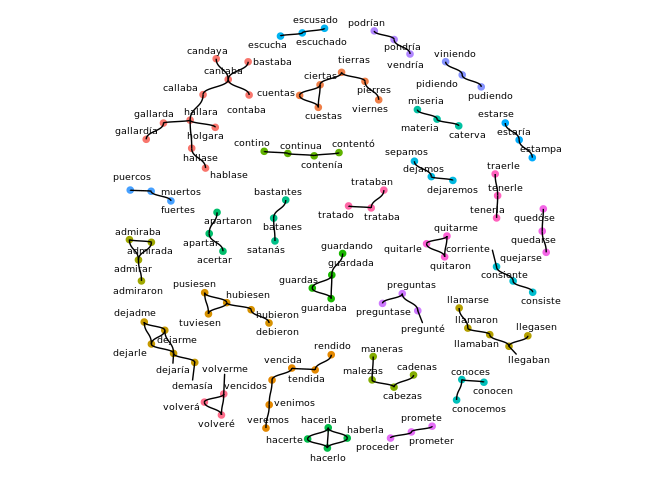
Happy clustering!