GNU/Linux Desktop Survival Guide
by Graham Williams

|
|
GNU/Linux Desktop Survival Guide by Graham Williams |

|
|||


R is excellent for generating graphs in many formats, including PostScript, PDF, PNG, and JPG. A highly recommended approach is to generate graphs in xfig format. These can then be loaded into the xfig application, for example, for further editing, if absolutely needed (perhaps you want to make minor changes but have lost the original R code used to generate the graph). And for LATEX processing the rubber package will automatically convert them to the appropriate EPS or PDF format. Of course, xfig can also generate PNG and JPG and many other formats.
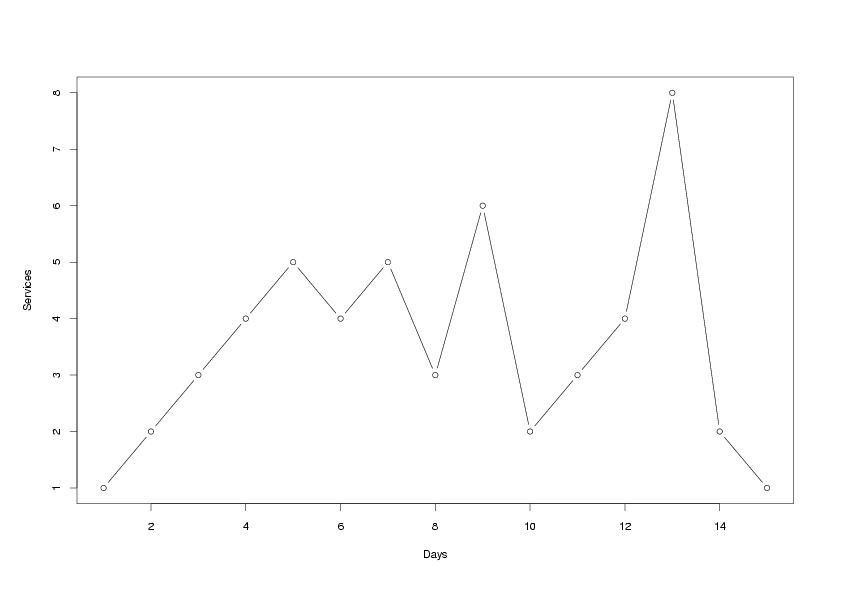
Generate a simple line and point graph:
Here's an interactive example to demonstrate the generation of a simple line graph.
  $ python
  >>> from rpy import *
  >>> l = [1,2,3,4,5,4,5,3,6,2,3,4,8,2,1]
  >>> r.postscript("rplot01.eps")
  >>> r.plot(l, type='b', xlab="Days", ylab="Services")
  >>> r.dev_off()
|

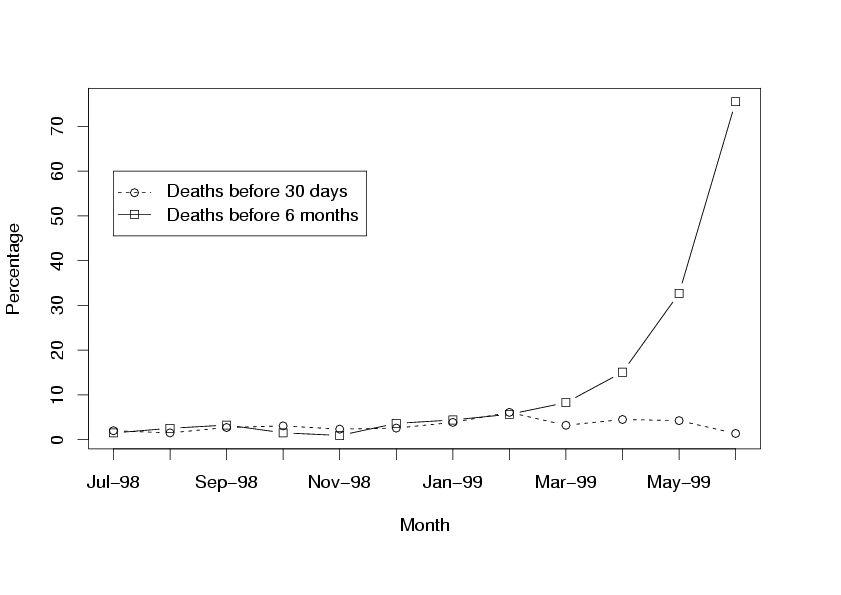
Two lines with a legend:
The following Python script generates a PNG graphic with two lines drawn.
from rpy import *
import os

dates = ('Jul-98', 'Aug-98', 'Sep-98', 'Oct-98', 'Nov-98', 'Dec-98',
         'Jan-99', 'Feb-99', 'Mar-99', 'Apr-99', 'May-99', 'Jun-99')
death30 = (2.02, 1.53, 2.73, 3.09, 2.37, 2.60,
           3.87, 6.11, 3.23, 4.52, 4.27, 1.40)
death6m = (1.52, 2.55, 3.28, 1.55, 0.95, 3.65,
           4.42, 5.68, 8.29, 15.08, 32.70, 75.52)


r.png("rplot02.png")
r.par(cex=1.5)
r.plot(death6m, type="b", xlab="Month", ylab="Percentage",
       lty=1, pch=0, axes=False)
r.lines(death30, type="b", lty=2, pch=1)
r.box()
r.axis(1, at=range(1,len(dates)+1), labels=dates)
r.axis(2, at=range(0,100,10))
r.legend(1, 60,
         ('Deaths before 30 days', 'Deaths before 6 months'),
         lty = (2, 1), pch=(1, 0))
r.dev_off()

os.system("gv rplot02.png")
|

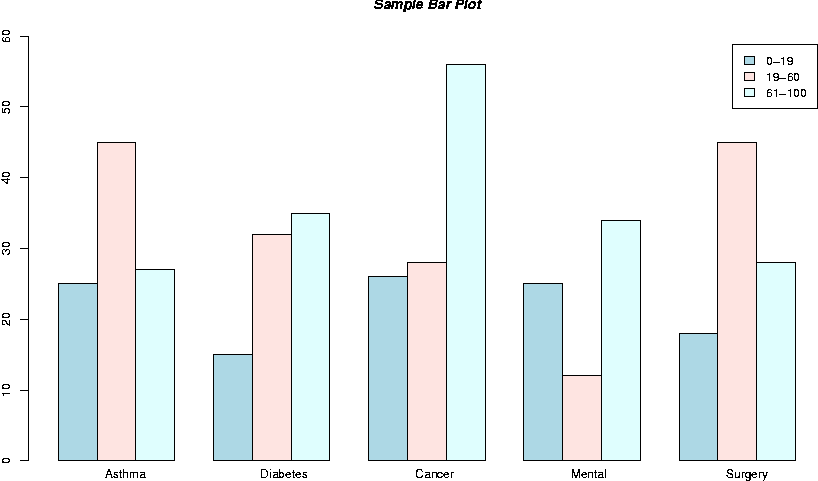
Generate a bar plot:
Here's a more complete Python program to generate a barplot
#!/usr/bin/env python

from rpy import *
import Numeric
import os,sys

ext = 'fig'
if len(sys.argv) > 1: ext = sys.argv[1]
dev = {'eps' : (r.postscript, 'gv'), 'pdf' : (r.pdf, 'xpdf'),
       'png' : (r.png, 'display'), 'fig' : (r.xfig, 'xfig')}
fn="rplot03." + ext
dev[ext][0](fn)

ages = ('0-19', '19-60', '61-100')
labels = ('Asthma', 'Diabetes', 'Cancer', 'Mental', 'Surgery')
bars = Numeric.array([[25,15,26,25,18],[45,32,28,12,45],[27,35,56,34,28]])

r.barplot(bars, beside = True, legend = ages, ylim = (-7, 60),
          col = ("lightblue", "mistyrose", "lightcyan"))
r.text((2,6,10,14,18), (-2,-2,-2,-2,-2), labels = labels, pos = 4)
r.title(main = "Sample Bar Plot", font_main = 4)
r.dev_off()

os.system(dev[ext][1] + " " + fn)
|

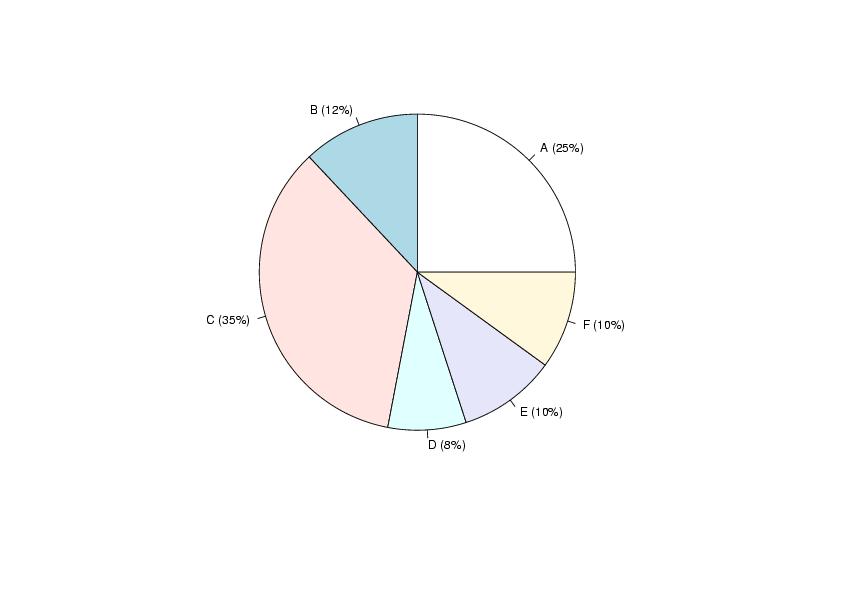
Generate a pie chart:
from rpy import *
import os

dates = ('A', 'B', 'C', 'D', 'E', 'F')
percs = (25, 12, 35, 8, 10, 10)
labs = ()
for i in xrange(len(dates)):
    labs += ("%s (%d%%)" % (dates[i], percs[i]),)

r.postscript("rplot04.eps")
r.pie(percs, labels=labs)
r.dev_off()

os.system("gv rplot04.eps")
|
